
Excel - Beyond the Bar Chart - Data Visualization and Data Story Telling Techniques
Recorded Webinar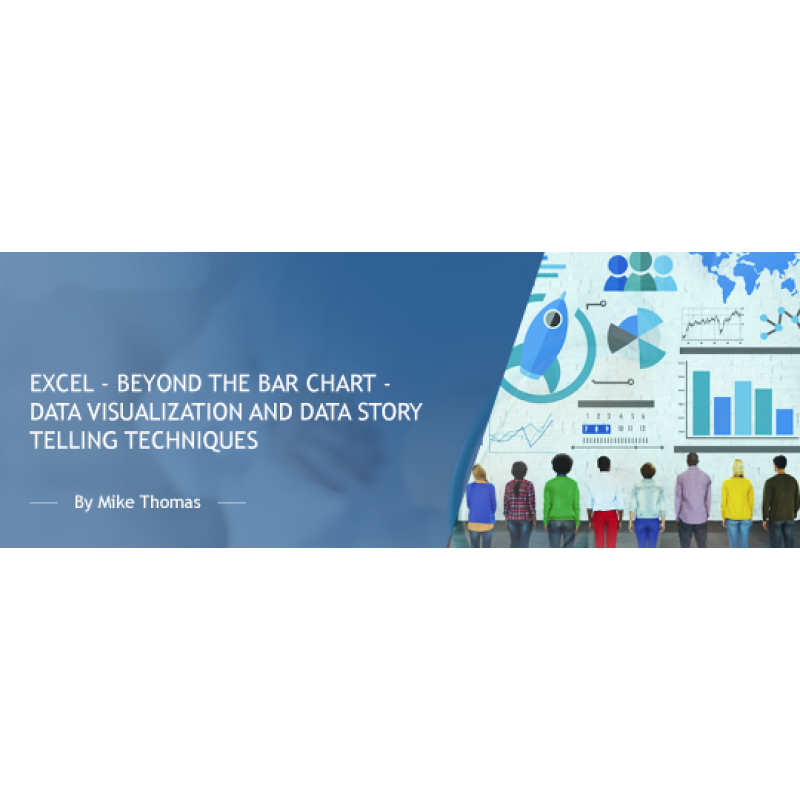
Description
Revolutionize the way you communicate data with this cutting-edge training on Excel visual storytelling. Discover the power of visual data representation to transform complex numerical information into compelling, insightful visual narratives.
The era of simple bar and pie charts has moved on. Today's data-driven environment demands more dynamic visualizations and infographics. Our session will guide you through Excel's innovative non-chart tools, empowering you to captivate your audience with data.
What You Will Master
- Selecting impactful visualizations that resonate with your message
- Crafting succinct Sparkline charts for at-a-glance data comparison
- Utilizing shapes, symbols, and icons for infographic-inspired displays
Why you should Attend
- Stay ahead of the curve by updating your Excel visualization toolkit
- Learn to meet and exceed audience expectations with sophisticated data presentations
- Excel is not just for spreadsheets anymore. Unlock its full potential for modern data
- communication
Topics We’ll Explore
- Constructing Sparklines for immediate data visualization
- Pioneering with Waffle Charts to "Square the Pie.”
- Designing vibrant infographics using shapes, images, and icons
- Generating heat maps with Conditional Formatting for data intensity display
- Symbolizing data trends with icon sets for clarity and impact
- Mapping out the world with Excel's 3D Map feature for geographical data storytelling
Who should Attend?
This intermediate-level training is perfect for Excel users eager to enhance their data visualization prowess. While we utilize the latest Excel version for demonstrations, the skills you'll learn are applicable to Excel 2010 and beyond, ensuring broad relevance and applicability. Join us to elevate your data presentation from standard to standout.
Webinar Details
- Venue: Recorded Webinar
Speaker:

Mike Thomas
Microsoft Trainer & Solution Developer: Excel, PowerBI & Office
Mike Thomas have worked in the IT training business since 1989 and although he has a subject matter expert in a range of technologies, particularly Mi...
Related Events

Using Artificial Intelligence to Enhance Student S...
In this session, we will examine how AI and indirect measures can be used to better guide assessment..

Excel - Pivot Tables - The Key To Modern Data Anal...
Excel - Pivot Tables - The Key To Modern Data Analysis and Reporting Whether you need to build an..
Excel - Build Advanced Pivot Table Solutions Using...
NOTE: This course is not appropriate for Mac or iPad users as the functionality does not exist on th..
Upcoming Webinars

Tattoos, Sandals, Yarmulkes, Dress and Appearance:...
From the length of one’s hair, to the number and location of visible tattoos, to recognizing gender ..

Inside an OCR HIPAA Breach Investigation: What Hap...
If your organization is the subject of an OCR breach investigation, you will be required to respond ..

HIPAA and Family Medical History - What to Know
Understanding how HIPAA applies to family medical history is essential for both patients and provide..